Forex lessons
Current page:
Home
» Forex lessons » Forex lesson
If you are confused by market terminology, Check out our terminology at any time
In the forex market, the most popular thing for investors is the monthly US non-agricultural employment data report.
It is well known that one of the most important data when non-agricultural data is published is the number of non-agricultural employment, so let’s suspect that non-agricultural employment is the number of employed people in the US non-agricultural data.
The number of non-agricultural employment can reflect the development and growth of manufacture and service industry, the reduction in numbers means that enterprises are reducing production and the economy is in a depression. When the social economy is fast, consumption naturally increases, and the number of jobs in consumption and service industries increases.
When the number of non-agricultural employment increase significantly, it indicates a healthy economic situation, which should theoretically be good for the exchange rate and may indicate higher interest rates, and the potential high interest rates prompt the foreign exchange market to promote the country's currency appreciation even more, vice versa.
Household surveys provide information on labor, household employment and unemployment. The employment report is often hailed as the “crown jewel” of all economic indicators that the foreign exchange market can respond to. It is the most sensitive monthly economic indicator in the market. Investors usually can find a lot of sensitive information of market in it, and the forex market pays particular attention to changes in the number of non-agricultural employment per month that are seasonally adjusted. The American non-agricultural employment data is one of the key economic data of the foreign exchange market. The release of this data could be a turning point in determining the direction of the foreign exchange market. It may also bring about violent fluctuations in the foreign exchange market, which may cause market confusion about the direction of the foreign exchange.
Therefore, this non-agricultural data is an important indicator for observing the extent and status of socio-economic and financial development. Non-agricultural employment is a project in the employment report, which mainly counts changes in positions of non-agricultural production.
Unlike other financial markets, the foreign exchange market has no specific location, nor a central exchange, but is traded through banks and electronic networks provided by ALLIED TOP FX. In other words, if you want to open a foreign exchange account, you need to open an account online.
Step 1 : apply for opening an account and submit account opening information;
Step 2: review the account opening information;
Step 3 : check the e-mail address and get the transaction account number;
Step 4: inject funds for the new account and activate the account
The economic sentiment index comes from the enterprise climate survey, which is a statistical survey system established by western market economies. It is compiled through regular questionnaire surveys of entrepreneurs and based on the judgments and expectations of entrepreneurs on business operations and macroeconomic conditions, thereby reflecting the company's production and operation status, economic performance, and predicting future economic development. Trend.
The economic sentiment index is currently reflected mainly by two indicators. The first is the entrepreneurial confidence index, which is based on the entrepreneur’s perception, judgment and expectation of the external market economic environment and macro policies of the enterprise (mainly through “optimistic” and “general” the index compiled by "not optimistic" is used to comprehensively reflect the entrepreneur's feelings and confidence in the macroeconomic environment. Second, the business climate index: based on the judgment and expectation of the entrepreneur's comprehensive production and operation of the enterprise (mainly through the choice of "good", "general", "poor"), to comprehensively reflect the enterprise production and operation status. The prosperity index is expressed in the range of 0-200. 100 is the critical value of the prosperity index, indicating that the climate change is not significant; 100-200 is the boom interval, indicating that the economic situation tends to rise or improve, the closer to 200, the more prosperous; 0-100 is the recession, indicating that the economic situation tends to decline or worsen, the closer to 0, the worse.
If you want to make money in a transaction, as long as you are disciplined, you can overcome your weaknesses in personality and the common weakness of humanity when appropriate.
When trading, like an athlete, buying and selling are all instinctive reactions rather than thinking. When the skills are in the upper body, the heart forgets it.
For real forex short-term traders, the deal is not a zero-sum game. It is full of gold everywhere, and there are opportunities to make money everywhere. For the cheap trader, we are engaged in the best career in the world, let’s in the case of lower risk, earning profits that other people in the industry can't dream of.
In the case of the foreign exchange market, the larger the transaction volume, the better, the shorter the trading time, the better, in order to make more money in less time and less risk.
Try to be a trader who gets meager profit and act on the principle of earning meager profits.
In essence, Charlie's trading strategy is: in the shortest possible time, to grasp any opportunity to obtain meager profit.
There is a type of trader who has been making money, and we are short-term traders who make small profits. Let's make a little profit at a time, make little by little, accumulate less, and finally gather wealth into the ocean of money.
As long as you can still do the right thing under pressure. Keep your position as much as possible, as long as you are still in the foreign exchange market, you always have the opportunity to make money.
Faced with loss, it is necessary to face it like a real man, not to escape. This is another level of courage.
For an ultra-short-term trader, making money, he has to go, not to earn, he has to go, lose, he has to go.
Never hold any loss position, always add to the position of making money, which is, in a certain sense, the true meaning of the transaction.
Almost all of the speculative foreign exchange investors started their own futures trading career from the short-term way of fast-forward and fast-moving, but this is not a short-term transaction in the true sense. This kind of transaction is different from real short-term trading. Most investors may have been in this similar and different trading state, and he also considers it to be a short-term trade.
However, a real short-term trade is like making money in a game, and a short-term trade that looks like a different god is like spending money on a game. The two are absolutely different. Successful short-term trading makes money in the game, but making money in the game is no easy task! Short-term trading relies mainly on the investor's sense of the disk, rather than rationally analyzing a large amount of fundamental information. The price fluctuations in the day mainly come from the mood and psychology of the trader and the role of funds, especially in the case of large shocks. This kind of market is also the ideal market for short-term traders. And a good sense of the disk can not be formed overnight, it needs to pay a huge or even painful price! Short-term trading is easy to imitate, but not easy to succeed! Because short-term trading requires investors' minds to coincide with market fluctuations, at least in most cases. Short-term trading requires very high demands on investors. The entry and exit of the game is not hesitant. The outcome is often determined by one point. The quick stop loss and the profitability of profit closing will exceed the imagination of ordinary investors.
Short-term trading seems to be easy and difficult, you can even trade with a short-term trader, and ultimately it is he who earns you. Normal people use their brains to decide actions, while short-term traders use their minds to decide actions, and even can be said to be the first reaction or instinctive reaction to trade. Short-term trading does not require the reasons for recognition by the world. It is a kind of physical and mental unity. It is an art, a kind of realm, you can sum up, but it is difficult to reach his height. The short-term trading model is only suitable for you and it is difficult to organize into textbooks. A successful short-term trade is a happy trade, a trade that makes a profit in the game. The short-term trade that is imitated is a tormented trade, and it is spending money to play the game. Successful short-term trading requires long-term trading experience, rather than reading, it is not knowledge but ability and comprehensive quality. Successful short-term traders are like top artists, easy to imitate but hard to reach our realm. But the joy of playing games will cause most people to choose short-term transactions that are different in shape and different in god. Let's spend money on games until the money is spent.
At present, the global gold market is mainly distributed in three regions of Europe, Asia and north America. Europe is represented by the London and Zurich gold markets; Asia is mainly represented by Hong Kong; north America is mainly represented by Winnipeg in New York, Chicago and Canada.
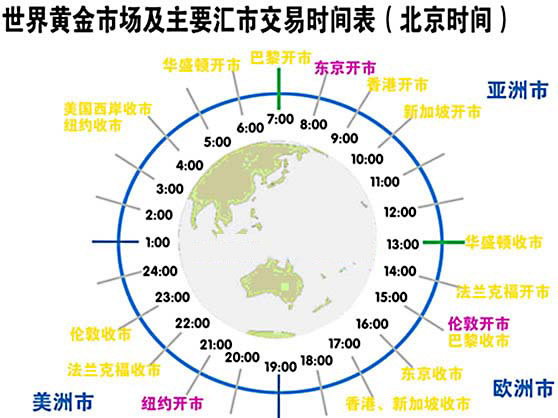
Trading hours in the world's major gold markets, based on London time, form a continuous gold trade in London and new York (Chicago): London's early morning pricing at 10:30 am opens the north American gold market. New York, Chicago, etc. Have opened their doors. When London was priced in the afternoon, New York and others were still trading, and Hong Kong has since joined. London's end market will affect the us morning market price, the us end market will affect Hong Kong's opening price, and Hong Kong's end market price and us closing price will affect London's opening price, and so on.
The gold market is a global market that can be traded 24 hours a day around the world. Gold is easy to cash in and can be quickly converted into any kind of currency, forming a convenient exchange relationship between gold, local currency and foreign currency. This is a prominent performance of gold still possessing monetary and financial functions in the contemporary era.
Inflation and interest rates
As the only non-credit currency in the world, gold has different forms of currency, such as banknotes and deposits. It has very high value itself, unlike other currencies, which are only representatives of value, and its value is minimal. In extreme cases, money is equal to paper, but gold does not lose its value as a precious metal at any time. Therefore, it can be said that gold can be used as an eternal representative of value. The most obvious manifestation of this meaning is the investment value of gold in the era of inflation - banknotes will depreciate due to inflation, and gold does not. Take the suit of the famous tailoring street in the united kingdom as an example. The price for five centuries is the standard of five or six ounces of gold. This is a testament to the long-lasting gold purchasing power. And a few dozens of pounds can buy a suit a few hundred years ago, but now only buy sleeves. Therefore, in the era of excessive liquidity and inflation, gold will be favored by investors because of its anti-inflation characteristics.
What has an important impact on the price of gold is the actual interest rate after deducting inflation. The actual interest rate after deducting inflation is the opportunity cost of holding gold. When the real interest rate is negative, people are more willing to hold gold.
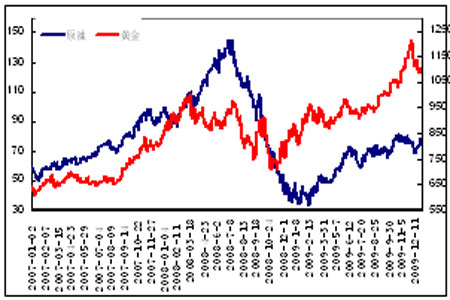
Example: real interest rate = nominal interest rate - inflation rate. Assume that the inflation rate = 4%, the bank's nominal deposit rate = 3%, the actual interest rate = -1%, and the 100-yuan deposit has a principal and interest of 104 yuan a year later. 104 yuan < 100 yuan a year ago. The chart below shows the comparison between the gold price and the real interest rate between 1969 and 2003. From the figure, we can see that during the entire 1970s, the actual interest rate was mostly less than 1% (the red line in the picture). During the same period, the price of gold broke out of a big bull market. In the 1980s and 1990s, the real interest rate was more than 1% for most of the time, during which gold prices struggled in the big bear market for 20 consecutive years. In addition, between 2001 and 2003, the real interest rate was below the 1% level, and these years are just the beginning of the big bull market.
Crude oil and related markets
1. Crude oil market 2. Stock market and commodity market 3. Commodity price index
1. Crude oil market crude oil is one of the most important commodities in the international commodity market. The significance of crude oil for gold is that the rise in oil prices will push inflation, thus highlighting the value of gold against inflation. From the historical data point of view, in the past 30 years, an average of one barrel of gold can be exchanged for 15 barrels of crude oil and the gold price is about 80% positive correlation.
Crude oil prices have risen from about $20/barrel in January 2002 to around $78 in July 2006. One of the reasons for the soaring oil price is that the world economy has grown steadily and rapidly. Both the united states and china's emerging market countries have performed very well in economic performance, which has led to a surge in demand for crude oil. The supply-side factor is the fragile balance of supply and demand in the world's crude oil industry. Due to the limited surplus capacity and the geopolitical turmoil, the market has been worried about the possible disruption of crude oil supply, which has pushed up oil prices for more than 20 years. High point.
Although the current crude oil price is still in the midst of the correction of the previous uptrend, the situation of fragile balance between supply and demand will continue for a long period of time. Therefore, it is difficult for oil prices to fall again, and the high level is still running. It is worth looking forward to.
Similarly, the rise in prices of other commodities in the international commodity market has the same effect on gold prices. The price of gold began in this round of bull market in 2000, accompanied by the international commodity market, with energy such as crude oil and copper, and the price of metals and some agricultural products rose sharply. From the 1804-2004 world commodity price chart, around 2000 is just the beginning of another round of historic big bull market for world commodity prices. In the past two hundred years, there have been five super-level bull markets, the shortest duration is 15 years, and the longest is 40 years. Every time the big bull market is accompanied by war and political tensions: the early 19th century was the English-French war of 1812; 19 the actual 60s was the American civil war; the important contributing factors of the three commodity markets of the twentieth century were one stop, world war ii. And the cold war. At present, the united states' "war on terror" on a global scale has already started in Afghanistan and Iraq, which means that the tension and turmoil in the world situation will continue for a long time.
2. Stock market and commodity market
The us stock market and commodity prices have repeatedly interpreted the relationship between “squatting boards”. In the 20th century, three commodities have been born in big bull markets (1906-1923, 1933-1953, 1968-1982), and each bull market lasted for more than 17 years. A little. During the three big commodities bull market, the corresponding situation is the long-term rise of the long-term bear market and inflation in the us stock market.
At present, this round of global commodities, represented by crude oil, metals and some agricultural products, has been around since 2000 and has been going on for more than six years. Due to the bursting of the high-tech bubble, the us stock market has been in the process of adjustment and decline since its last record high in 2000, especially the NASDAQ index, which is currently only 1/2 of the all-time high.
As an alternative investment method for stocks, gold prices have a high negative correlation with the us stock market. In the historical big bull market in the us stock market, gold prices are on the long road of 20 years.
3. Commodity price index
The price trend of the entire commodity market has a significant impact on the price of gold, so analyzing and tracking the trend of commodity prices has become an issue that investors must face and solve. Commodity investors usually use the analysis of commodity price index as an important means to judge commodity price trends. Here we briefly introduce the relevant knowledge of commodity price index.
The commodity index based on commodity prices has been in the international market for nearly 50 years. In the past half century, the commodity index has played an extremely important role in both the commodity market and the analysis and guidance of the macro economy. Character.
The earliest commodity index was a futures price index compiled by the Commodity Research Bureau in 1957 based on the prices of 22 basic economically sensitive commodities on the world market, often referred to as the CRB index. Futures contract of CRB was listed on the New York Mercantile Exchange in 1986.
In the 1980s and early 1990s, Goldman Sachs, Dow Jones, and standard & poor's also launched their own commodity futures price indices, and introduced a weighted method to assign weights to the commodity components in the index. These indices are currently the market-focused Goldman Sachs commodity futures price index (GSCI), Dow Jones commodity futures price index (DJ-AIG), and standard & poor's commodity futures price index (SPCI).
Since the 1990s, with the continuous improvement of global economic and financial integration, in order to meet the potential demand for hedging and speculation of various futures traders, the development of commodity futures index has entered another new stage of vigorous development, such as LMEX metal futures index created by LME(January 1999), CBOT created a more flexible and diversified X-FUND fund index (February 2002) and so on.
At present, many famous commodity price indices have become the trading varieties of the futures market. In recent years, the CRB index and the Goldman Sachs commodity index have been very active in futures contract trading, and have become an important trading tool for various commodity investment funds. The Goldman Sachs commodity index, in which energy is the main weight, has become a shining star in the commodity bull market.
The international commodity index not only has strong influence in the commodity futures market and the securities market, but also provides early warning signals for macroeconomic regulation and control. The study found that commodity indices are mostly ahead of CPI and PPI. The trend of commodity indices and the trend of macroeconomics are highly correlated. When the economy enters the growth period, the commodity index will go out of the bull market; when the economy enters the shrinking period, it is accompanied by the bear market of the commodity index. From this perspective, the trend of the commodity index has become a microcosm of the macroeconomic trend.
Insufficient and limited fundamental analysis
Before the investor trades in gold, the first step is to conduct a fundamental analysis. Without a basic analysis, it is impossible for investors to know the current status of the market, whether the gold market is shrinking or will increase; whether the market conditions are overheated; whether it should enter the market or leave the market now; whether the investment funds should increase or decrease; how the market tends to go, all the basic factor analysis is an indispensable step.
But the basic analysis of gold still has certain limitations:
Data from some gold producing countries are difficult to obtain or time lag
Some gold-producing countries are reluctant to publish gold figures to the international market, or the number of publications has a certain lag period, and the experts' figures can only be estimated. Therefore, when these countries are taking foreign exchange, the amount of gold they launch in the market may completely oscillate the market. The basic analysis is somewhat incomplete in this regard.
Open market, demand numbers are difficult to be precise
The figures for gold supply only need to add the annual output of the major gold producing countries to obtain more effective figures. . However, the acquisition of figures on the demand side is more difficult. For example, some companies will melt gold coins for industrial production, so that the number of demand contains factors of double counting. Therefore, it is impossible to perform fundamental analysis with accurate numbers.
Can't tell us when to enter the market
After the fundamental analysis, we all know that the price of gold is in the big bull market. But which day is it involved? If you do more now, the price may be lower after the day. Wait until next week to buy, maybe now is the lowest price. Therefore, the fundamental analysis can only tell us the general trend of the gold price, and simply can not provide us with the best time to enter the market.
Can't capture the recent peaks and valleys
Even in the big bull market stage, the price of gold will rise and fall. If you can grasp the trend of each wave, absorb it at a high place, and take it out at a low place, the profit obtained must be much higher than the simple hold. The basic analysis does not capture these subtle changes. It is based on the basic analysis that can only analyze the general trend of the market, but can not answer the reasons for the ups and downs of the market price. Therefore, in addition to the basic analysis in the gold trading, it must be supplemented by technical analysis.
The analysis methods of gold investment are divided into fundamental analysis and technical analysis, both of which have their own advantages and disadvantages. In addition to having an accurate source of information, investors must also master the technical analysis of this advantageous weapon. Technical analysis originates from statistics. It helps us find the best price for intervention in the market. It is complementary to basic analysis and is an indispensable analytical tool.
The technical analysis is to express the future price trend by expressing the daily price fluctuations in the market, including the daily opening price, closing price, highest price, lowest price and trading volume. . No single analytical method can be perfect. We can neither rely too much on technical analysis nor on basic analysis. In theory, after the basic analysis, you can use technical analysis to capture every rising wave and falling wave of the gold market, buy low and sell high, in order to earn more profits. Technical analysis is an objective analysis method based on mathematical statistical equations. It has a strong logic. It filters the subjective opinions of investors and is much more stable than the analysts who rely on personal feelings.
Technical analysis studies past price and volume data to predict future price trends. This type of analysis focuses on the composition of charts and formulas, captures major and minor trends, and identifies buy/sell opportunities by estimating the length of the market cycle. Depending on the time span you choose, you can use the technical analysis of the day (every 5 minutes, every 15 minutes, every hour), or you can use the weekly or monthly k-line for technical analysis.
Basic theory of gold technology analysis
Dow Jones theory
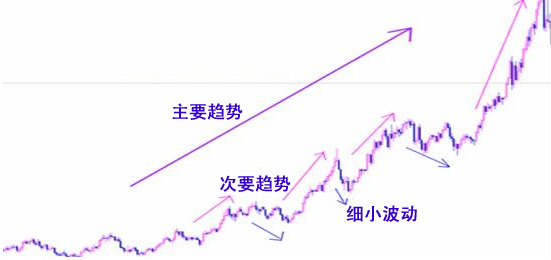
A basic assumption of Dow Theory is that the market responds to all the information. The main content is that the trend of the financial market is represented by three different trends – major trends, secondary trends and small fluctuations. The main trend represents the long-term trend, and the secondary trend is the correction of the main trend, which is the interruption of the trend and the movement in the opposite direction. The secondary trend in the bull market is called a temporary decline, and the secondary trend in the bear market is called a temporary rise. Small fluctuations are changes in the market every hour of the day. Among the three trends, long-term investors are most concerned about the main trend, the purpose is to buy as much as possible in the long market, and sell in time before the formation of the short market.
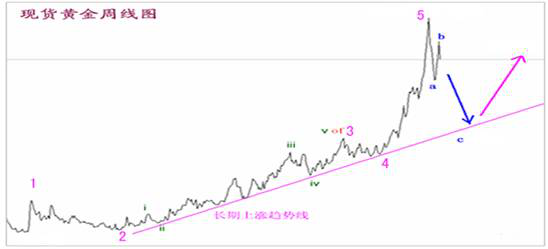
Elliott Wave Theory
The basic principle of wave theory is that the period of price fluctuation is wave-like motion, and each cycle is divided into five main waves and three minor waves. These wavy patterns can represent future indicators and reversals. These eight trends form a complete wave cycle with time spans ranging from 15 minutes to decades. Therefore, the key to Elliott Wave Theory is the ability to identify the environment in which a particular wave is located.
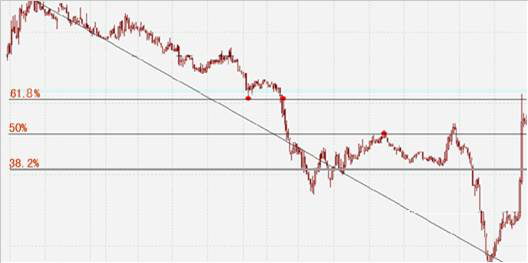
Fibonacci reversal
This is a widely used group of counter-motions based on the ratio of numbers produced by natural and man-made phenomena. This phenomenon is used to determine the magnitude of the rebound or retrospective range between the price and its underlying trend. The most important level of reversal phenomena is 38.2%, 50% and 61.8%. The three golden ratios represent the first, second and third target price of the rebound, respectively, and the first, second and third resistance (or support) of their upside (or downside), of which 50% the most important effect is commonly known as the "1/2 adjustment rule." The reverse mode can also be explained by the Dow Jones theory.
Main content of technical analysis
K-line chart
K-line chart, also known as candlestick chart, is generally divided into: day k line, week k line, month k line and minute k line. Its formation depends on four data in each calculation unit, namely the opening price, the highest price, the lowest price and the closing price. When the opening price is lower than the closing price, the k line is the positive line; when the opening price is higher than the closing price, the k line is the negative line; when the opening price is equal to the closing price, the k line is called the cross star. When the k line is a positive line, the thin line between the highest price and the closing price is called the upper shadow line, and the thin line between the lowest price and the opening price is called the lower shadow line, and the column between the opening price and the closing price. It is called an entity (as shown in figure 1 below).
Discover the trend
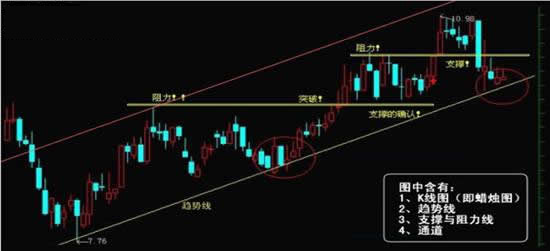
The trend is your friend. Finding the dominant trend will help you to look at the overall market orientation and give you a sharper insight, especially when shorter-term market volatility disrupts the market, weekly and monthly chart analysis. Ideal for identifying longer-term trends. Once you find an overall trend, you can choose between the time spans you want to trade (as shown in figure 1 below).
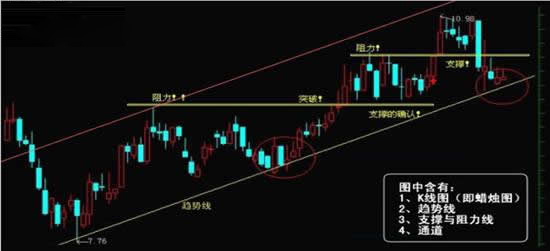
Support and resistance
Support and resistance levels are points in the chart that are subject to constant upward or downward pressure. The level of support is usually the lowest of all chart modes (hourly, weekly, or yearly), and the resistance level is the highest point (peak point) in the chart. When these points show a tendency to reproduce, they are identified as support and resistance. The best time to buy/sell is near the support/resistance level that is not easily broken. In the rally market, the broken resistance level may be the support for the upward trend; however, in the down market, once the support level is broken, it will turn into resistance (as shown in figure 1 below).

Figure 1
Lines and channels
Trend lines are simple and practical tools for identifying market trends. The upward straight line is formed by connecting at least two consecutive low points. Naturally, the second point must be higher than the first point. The extension of the line helps to determine where the market will follow the path of motion. The variability of trading lines is somewhat related to the number of connecting points. However, it is worth mentioning that the points do not have to be too close. The channel is composed of two parallel orbital lines, which are trend lines in the same direction. Two lines can indicate a price up, down, or horizontal corridor (as shown in figure 1 below).
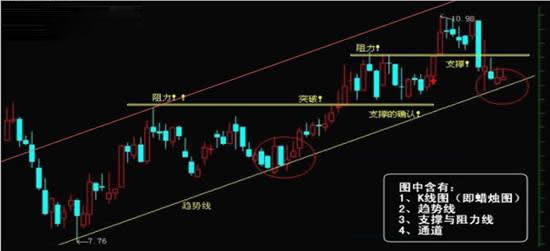
Figure 1
Moving average
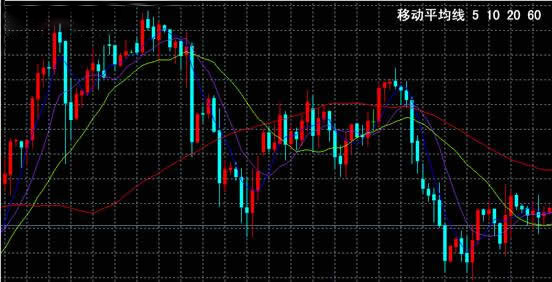
If you believe in the credo of "trends are your friends" in technical analysis, then the moving average will benefit you. The moving average shows the average price at a particular time in a particular period. They are called "mobile" because they are measured at the same time and reflect the latest average. One of the shortcomings of moving averages is that they lag behind the market and therefore may not be a sign of a trend shift. To solve this problem, using a short-period moving average of 5 or 10 days will reflect recent price movements more than a 40 or 200-day moving average. Alternatively, the moving average can also be used by combining the average of two different time spans. Whether using a 5 and 20-day moving average or a 40- and 200-day moving average, the buy signal is usually detected as the shorter-term average goes up through the longer-term average. In contrast, the sell signal is prompted when the shorter-term average goes down the longer-period average. There are three mathematically different moving averages: a simple arithmetic moving average, a linear weighted moving average, and a squared coefficient weighted average. Among them, the last one is the preferred method because it gives more weight to the most recent data and considers the data throughout the financial instrument's cycle.
Reversal form
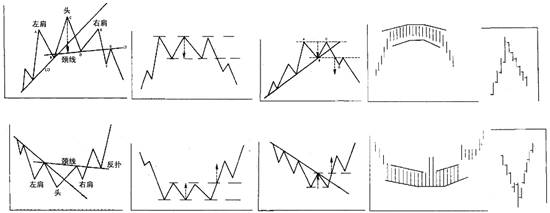
This means that the trend is undergoing an important reversal, mainly including the following forms:
Head and shoulder top - the graphic consists of the left shoulder, the head, the right shoulder and the neckline. It is one of the most common inverted shape charts.
Head and shoulder bottom - consisting of the left shoulder, head, right shoulder and neckline. The three continuous valleys are the deepest at the bottom (head).
Triple top - is a form of a turnaround chart formed by three similar highs, usually appearing in rising market conditions.
The triple bottom - the reflection of the triple top form, formed in the fall of the market with three points of similar low.
Double top - commonly known as m head graphics, double top is a major turn signal in the graphics.
Double bottom - commonly known as the bottom of the w, is the trend graph formed when the price falls twice to a low point in a certain period of time.
The dome and the round bottom - also known as the dish or bowl - are a reversal pattern, but not common.
The v-shaped form – representing a dramatic market reversal, is very different from the usual way in which the market gradually changes direction.
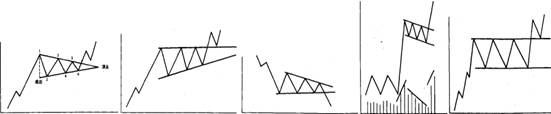
Continuous form
It is likely that the market will only be temporarily retired for a period of time. After adjusting for the recent overbought or oversold conditions, the existing trend will continue to develop. It mainly includes the following forms:
Symmetrical triangles, ascending triangles, descending triangles, flags, and rectangles (as shown).
Oscillator
Oscillator(theory of contrarian opinion): within the upper and lower boundaries of the oscillator, it can be marked as a scale from 0 to 100, or as a scale of -1 to 1, with the horizontal line in the middle being the zero line. Usually, regardless of whether the oscillator reaches the upper or lower limit of the boundary, it means that the price movement at that time may be too large. Therefore, the market is about to undergo adjustment or consolidation. Generally speaking, when the oscillator enters the lower boundary of the region, the investor buys; when entering the upper boundary of the region, it should be sold; when crossing the zero line, it constitutes a buy or sell signal. The common oscillators are mainly the following:
Moving Average Convergence / Divergence - MACD
Relative Strength Index - Relative Strength Index
Average True Range of Fluctuations - Average True Range
Bull / Bear Power - Bulls / Bears Power
Dem Indicator - Demarker
Strength Index - Force Index
Cloud Chart Indicator - Ichimoku Kinko Hyo
Momentum Indicator - Momentum
Moving Average of Oscillator - Moving Average of Oscillator
Relative Vigor Index Indicator - Relative Vigor Index
Stochastic Index - Stochastic Oscillator
William's Indicator - William's Percent Range
(Note: the technical analysis is profound and the tutorial is only a brief introduction. If investors want to know more, it is recommended to read John Murphy's technical analysis related works, which is the most comprehensive technical analysis book by far.)

Risk warning: All financial products of margin trading are high-risk. They are not suitable for all
investors and your losses may exceed your initial investment amount. Please confirm that you fully
understand the risks and seek professional advice if necessary. For more information, please check our
complete risk warning and disclaimer.
Registered address: OFFICE/SUITE NO.9B22 ND FLOOR TOWER 1 CHINA HONG KONG CITY KL
Registration number: 2507198
Actual business address: Suite 2209B 22/F, Tower 1, China Hong Kong City , 33 Canton Road, Tsim SHA Tsui, Kowloon, Hong Kong
Contact number: +852 31041565
Email: admin@alliedtop.com.cn
Disclaimer: The relevant information on this official website is not applicable to residents or customers of the United States, Singapore, Hong Kong, North Korea, and Iran, who use relevant information from the aforementioned regions for transactions, or anyone in this country or jurisdiction who uses it. If used, it will violate local laws and regulations.

